
The relentless rhythm of commerce across the United States, a system dependent on the constant flow of goods by truck, has encountered a formidable new chokepoint at a critical Chicago interchange, signaling deepening stress on the nation’s supply chain. This year’s analysis of freight movement reveals not just a new leader in traffic congestion but a broader, more troubling trend of slowing speeds and rising costs that directly impact businesses and consumers alike.
America on the Move: The Vital Role of National Freight Corridors
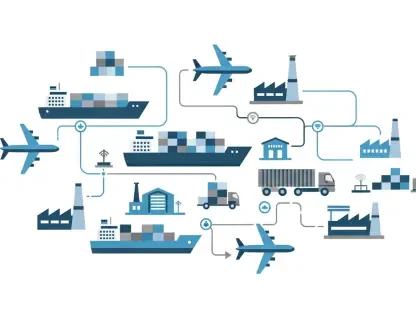
The trucking industry serves as the undeniable backbone of the U.S. economy, a vast network of highways and arteries that carries the overwhelming majority of goods to market. From raw materials headed to factories to finished products destined for store shelves and front doors, the efficiency of this network is a direct indicator of the nation’s economic health. When these corridors flow freely, the supply chain operates smoothly; when they become clogged, the entire system feels the strain.
To monitor the health of this critical system, the American Transportation Research Institute (ATRI) releases its annual report, a comprehensive diagnosis of the nation’s logistics network. The 2026 report provides an unparalleled view into the state of freight movement by analyzing a massive dataset of 2025 truck GPS data. This extensive research covers over 325 critical freight locations, identifying the most significant chokepoints and providing the empirical evidence needed to understand and address national infrastructure challenges.
The State of Gridlock: Key Findings and Economic Forecasts
A National Slowdown: Tracking the Worsening Congestion Trend
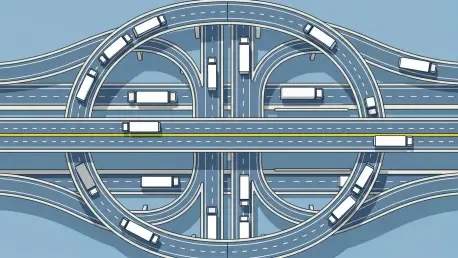
This year’s findings mark a significant shift in the geography of gridlock, with Chicago’s I-294 and I-290/88 interchange officially unseating Fort Lee, New Jersey, as the country’s worst freight bottleneck. This change at the top of the list points to evolving traffic patterns and underscores the persistent infrastructure challenges facing major metropolitan freight hubs.
Beyond a single location, the data reveals an undeniable trend of deteriorating traffic conditions nationwide. Average rush hour truck speeds across all monitored bottlenecks have fallen to just 33.2 mph, a concerning drop from the previous year. The situation is even more dire at the top 10 most congested spots, where trucks crawl at an average of 29.6 mph. The concentration of these chokepoints in logistics centers like Atlanta and Houston, which both feature multiple locations in the top 10, highlights the systemic nature of the problem.
The Billion Dollar Backup: Quantifying the Cost of Congestion
The economic impact of these slowdowns is staggering, translating directly into higher costs for consumers. ATRI estimates that freight congestion adds a colossal $109 billion to the price of goods and services annually, a hidden tax levied by inefficiency. This cost is a direct result of wasted time, excess fuel consumption, and disrupted delivery schedules that ripple through the entire supply chain.
Moreover, the delays represent an immense loss of productivity for the trucking industry. The time spent idling in traffic is equivalent to sidelining 436,000 commercial truck drivers for an entire year, exacerbating labor shortages and reducing the overall capacity of the nation’s freight system. As Congress prepares for the upcoming surface transportation program reauthorization, this data provides a crucial, forward-looking perspective on where investment is most urgently needed to restore efficiency.
Behind the Bottleneck :The Cascading Consequences of Delays
For the trucking industry, these bottlenecks create a cascade of operational challenges. Disrupted schedules make it nearly impossible to meet delivery windows, leading to frustrated customers and potential penalties. This unpredictability also forces logistics planners to build extra time into routes, reducing the number of trips a driver can make and ultimately decreasing the efficiency of every asset. Furthermore, the constant stop-and-go traffic drastically increases fuel consumption, driving up operational costs that are inevitably passed down the line.
The consequences extend far beyond the logistics sector, impacting society and the environment. Idling vehicles are a significant source of carbon emissions, contributing to air pollution in the very communities situated near these congested corridors. For everyday consumers, the most direct effect is on their wallets. Infrastructure limitations that slow down freight movement directly translate into higher prices for everything from groceries to electronics, as the increased cost of transportation is baked into the final price of every product.
A Call to Congress: Data Driven Policy for Infrastructure Renewal
The strategic release of the ATRI report serves as more than just an analysis; it is a clear roadmap for policymakers. By pinpointing the exact locations where freight mobility is most severely constrained, the data allows for the development of targeted, high-impact solutions rather than broad, unfocused spending. It transforms the conversation from one of general infrastructure decay to a specific, actionable agenda.
This data-driven approach is critical as lawmakers consider federal legislation and funding allocations. Addressing freight-specific infrastructure needs requires a nuanced understanding of where a dollar invested will yield the greatest return in efficiency and economic benefit. The report emphasizes the necessity of using this empirical evidence to ensure that public funds are directed toward the most critical projects, maximizing their impact on the national supply chain and the economy as a whole.
Paving the Way Forward: Proven Solutions and Future Priorities
There is a strong consensus among industry stakeholders that freight congestion, while worsening, is a solvable problem. The key lies in sustained and strategic investment in infrastructure. The ATRI report does not just identify problems; it implicitly points toward a proven solution that has worked in the past, offering a blueprint for future success and a reason for optimism.
The transformation of Chicago’s Jane Byrne Interchange stands as a powerful testament to this approach. Once a fixture at the top of the bottleneck list, this interchange no longer ranks in the top 25 thanks to major capacity expansion projects. This success story demonstrates that targeted infrastructure improvements can effectively eliminate chokepoints, restore fluidity to freight corridors, and produce tangible economic benefits. It provides a clear model for how to address the current list of underperforming interchanges.
The Bottom Line? Investing in Movement to Secure America’s Future
The latest findings on the nation’s freight bottlenecks delivered an urgent and unambiguous message: the arteries of American commerce are increasingly clogged, and the economic consequences are severe. From the new top chokepoint in Chicago to the systemic slowdowns in major hubs across the country, the data painted a clear picture of a system under immense strain, where delays have become the costly norm.
This situation underscored the direct and undeniable connection between infrastructure investment, economic health, and the quality of life for all citizens. Looking back at past successes, such as the revitalization of the Jane Byrne Interchange, provided a clear and proven blueprint for action. Leveraging these lessons to address current chokepoints is not merely an option but a critical necessity for strengthening the national supply chain and securing a more prosperous and efficient future.